Results and Case Studies in Real Estate Project Marketing
Many marketing firms display cumulative unit counters and logo walls without one figure a prospective client can inspect. We chose the opposite direction. This page presents the data we can substantiate today, the way we measure client work, and what we will not publish until it is real. Transparency is the evidence, not the slogan. This is the trust page for our real estate marketing system for developers and contractors.
- Search impressions
- 8.69M
- Clicks outside Israel
- 58%
- Attributed inquiries
- 350+
Project launch system
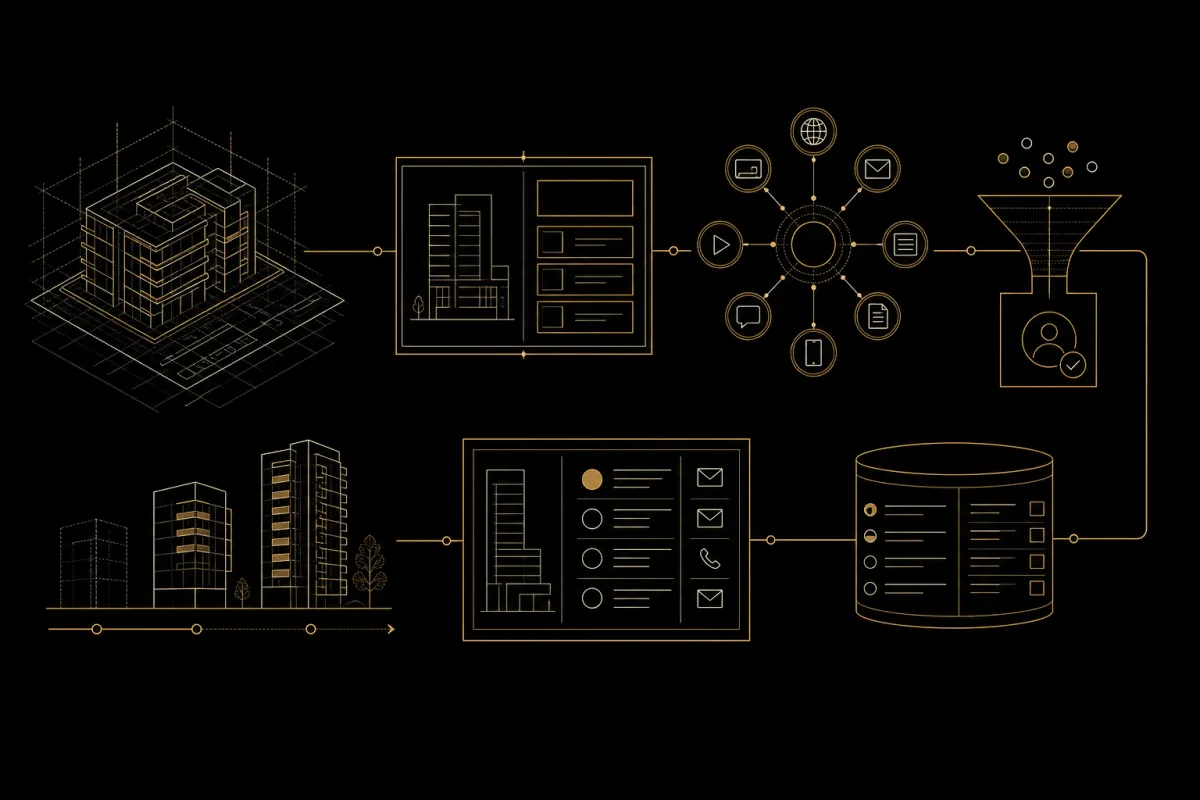
A launch system, not a collection of ads
Positioning, channel execution, lead qualification and sales follow-through must work as one operation. The visual makes those handoffs explicit.
- Positioning
- Channel plan
- Qualification
- Sales follow-through
What This Page Is, and What It Is Not
This is not an ordinary SEO page, and it is not a wall of promises. It is our measurement standard. Here you will find verified data from our own platform, the funnel we report in client work, and the weekly report structure. What you will not find, at least yet, is a case study with client names, project sales figures, or results we cannot verify. When real material is approved for publication, it will appear here with numbers.
The Data We Can Show Today
These figures come from our platform and systems, and each one can be checked:
Sources: Google Search Console and Google Analytics 4 for semerenkogroup.com, and our CRM. Checked July 2026.
The geographic detail behind 16 months of clicks is: United States 20,734, United Kingdom 4,754, Canada 2,250, France 1,050, and Australia 1,014, alongside 27,784 clicks from Israel. This is the audience our platform already reaches, and it is the evidence behind our focus on English-speaking and overseas buyers.
How We Measure Client Work
Not by clicks, and not by CPL alone. We measure the full funnel from inquiry to deal, and report every stage:
| Stage | What is measured |
|---|---|
| Inquiries | Volume and exact source for every channel and campaign |
| Qualified inquiries | How many met the agreed definition: budget, city, timing, and financing capacity |
| Meetings | How many were booked and how many actually took place |
| Registrations and deals | Pipeline progress, where disclosure is permitted, with a loss reason for prospects who did not progress |
| Attributed cost and revenue | Cost per meeting, cost per deal, and revenue attributed to source |
We explain the complete method, including why CPL alone misleads and how to calculate cost per deal, on Lead Management and ROI Measurement for a Real Estate Project. The operating layer behind that measurement is covered on our CRM, Automation, and Marketing Measurement page.
What We Count, and What We Refuse to Count
Measurement discipline begins with definitions. Without an agreed definition of a "qualified lead" and a "deal," every report becomes an argument. We therefore set both in writing with the client before work begins.
What we count
Unique inquiries by exact source, inquiries that met the quality criteria, meetings that took place, pipeline progress, and the true cost per deal. Each is measurable, inspectable, and connected to the CRM.
What we refuse to count
Impressions presented as results, clicks presented as inquiries, and "leads" nobody contacted. Large numbers that say nothing about sales are precisely what can conceal weak performance.
Attribution: First Source, Last Source, and Everything Between
A real estate deal is almost never closed from one touch. A buyer sees an advertisement, returns through search, reads content, and speaks on WhatsApp before submitting details. A model that credits only the final touch penalizes channels that opened the door. A model that credits only the first touch ignores what moved the buyer forward. We therefore preserve both first and last source and review the complete sequence. That makes it possible to allocate budget according to real contribution rather than whichever source happened to be last.
The Weekly Management Report
Management does not need a crowded dashboard. It needs a clear picture that supports a decision. Our weekly report includes:
- This week's inquiries by source and campaign, compared with the previous week and month
- The qualified-inquiry rate and comparison with target
- Meetings booked and completed, and average response time to an inquiry
- Pipeline progress, including deals and loss reasons
- Cost per meeting and cost per deal by channel
- One clear recommendation: what to increase, what to change, and what to stop
The report is designed to identify the bottleneck between marketing and sales, not hide it. If meetings take place and do not close, the report will show that even when marketing is not the problem.
What We Will Publish, When It Exists
A real case study requires real data: the project type, the original problem, audiences and countries, channels, inquiry and qualification volumes, contact rate, and sales results when they may be disclosed, together with what failed and what changed. Until we have material of that quality, approved for publication and genuinely useful, we will not invent it. A false case study is worse than no case study because it will eventually be tested.
When we publish one, it will include redacted and verified screenshots, a real weekly report sample, a transparent measurement method, and a verified client statement. Until then, the evidence is the data above and your ability to inspect it yourself.
The Limits of the Data
Precision also requires saying what the figures do not show. The data above demonstrates reach, audience, and measurement infrastructure. It does not prove a guaranteed outcome for your project. Platform scale is not a guarantee of sales, and every project depends on its price, location, product, and market at the time. What we bring is audience access, a measurement system, and a process. Results are established together and measured honestly.
How to Check Us Today
You do not need to take our word for it. The platform is live and public, the rankings can be checked in Google, and our trust pages are open: learn who we are on About Us, who stands behind the company on the founder page, and how we are paid on the pricing page. Transparency begins with being open to inspection.
Discuss Your Project Marketing
Send us the basic project details. We will respond with an honest view of what fits, what should be measured, and what a weekly report would look like for your project. You may also request a sample report structure.