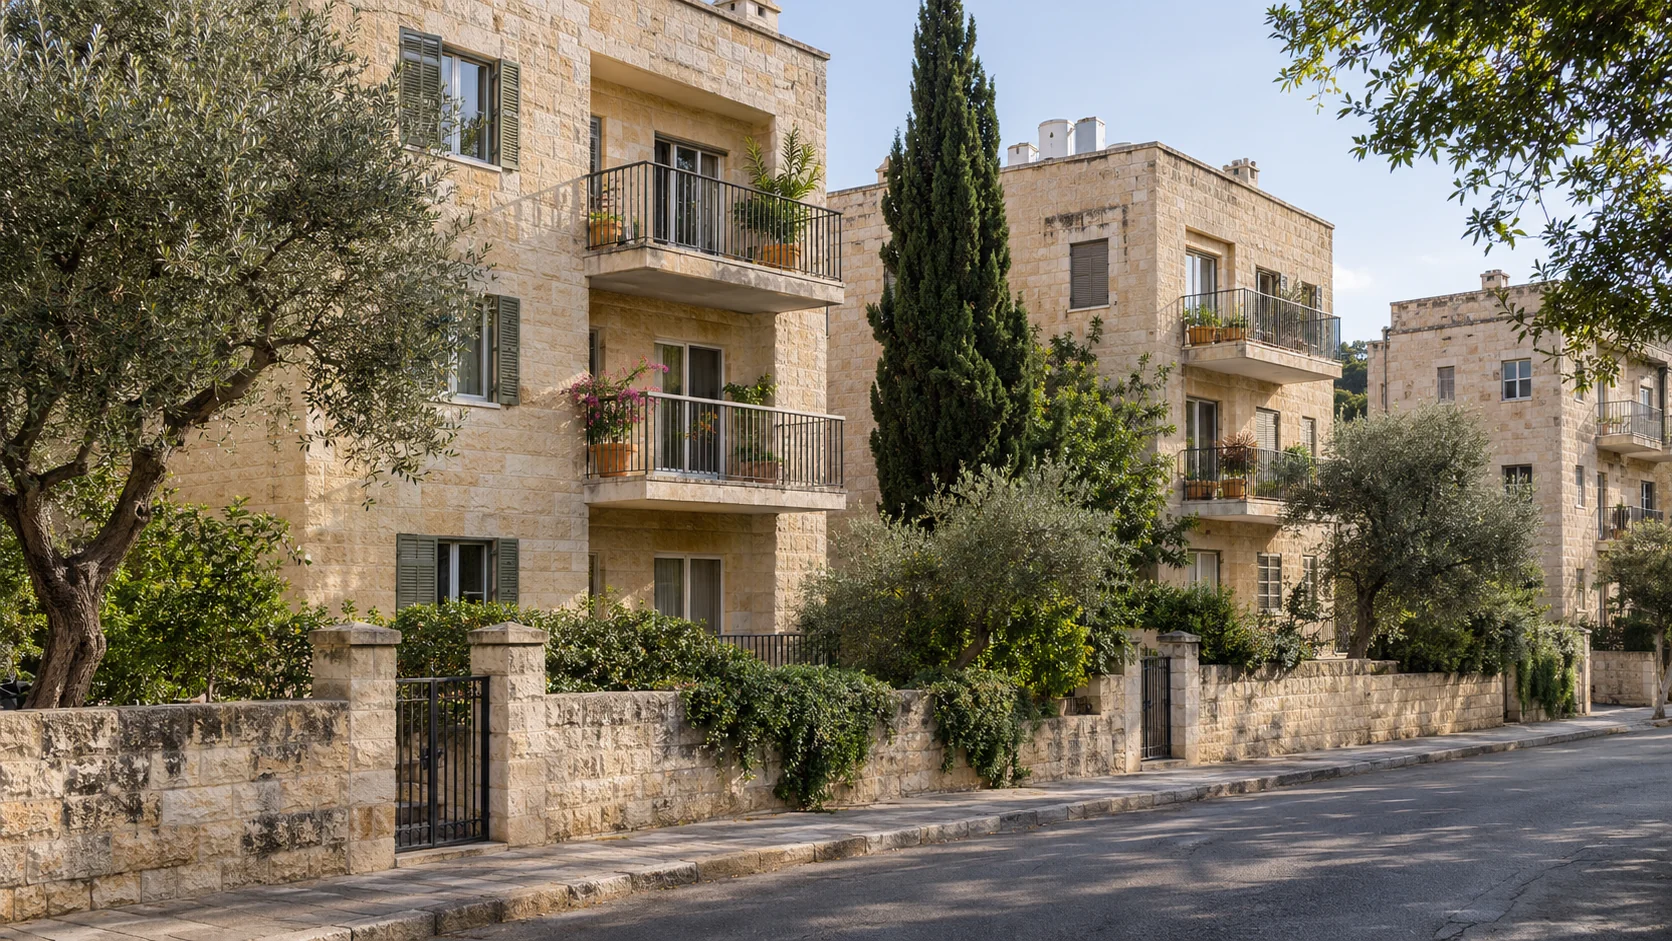
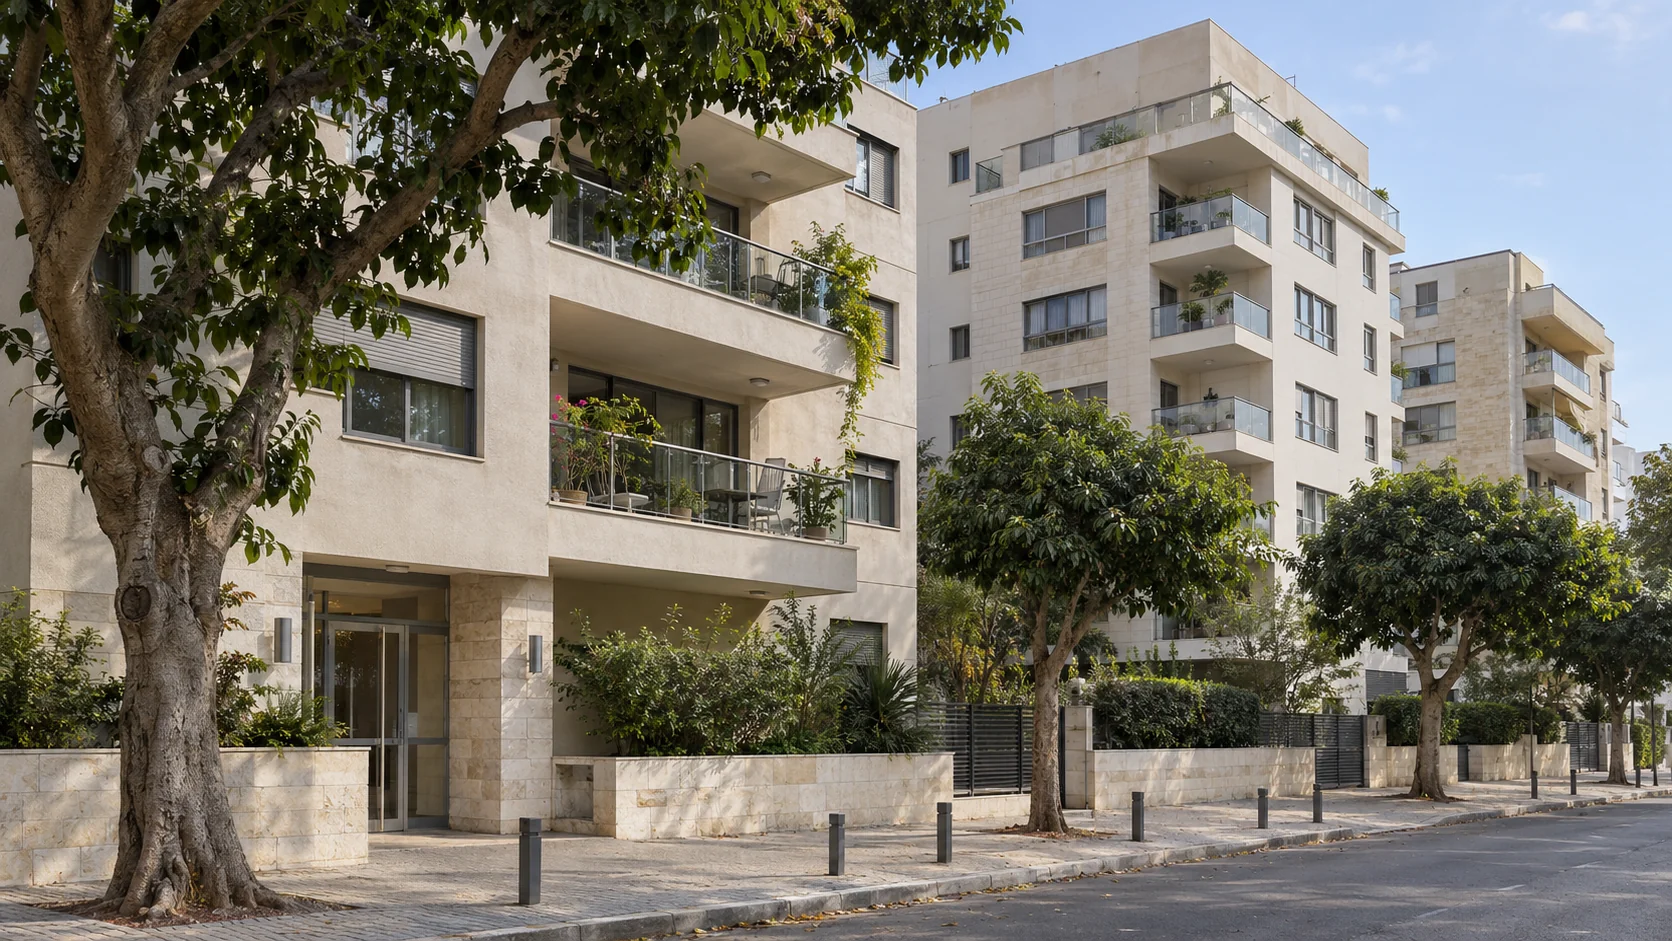
Israel’s home-price index fell 0.2% for August and September transactions, according to the Central Bureau of Statistics release published on November 15. A separate measure in the report put the average third-quarter deal at NIS 2,286,700, down 5.7% from the previous quarter. That larger fall is not a measure of how much every comparable home became cheaper.
| Measure and period | Result |
|---|---|
| Home-price index: August to September versus July to August 2026 | Down 0.2% |
| Home-price index: August to September versus a year earlier | Down 1.5% |
| New-home index: August to September versus July to August 2026 | Down 0.7% |
| Average transaction price: third quarter of 2026 | NIS 2,286,700; down 5.7% from the second quarter |
Source: Central Bureau of Statistics, release 361/2026. The latest three index periods and the latest quarterly average are provisional because some transactions have not yet been reported.
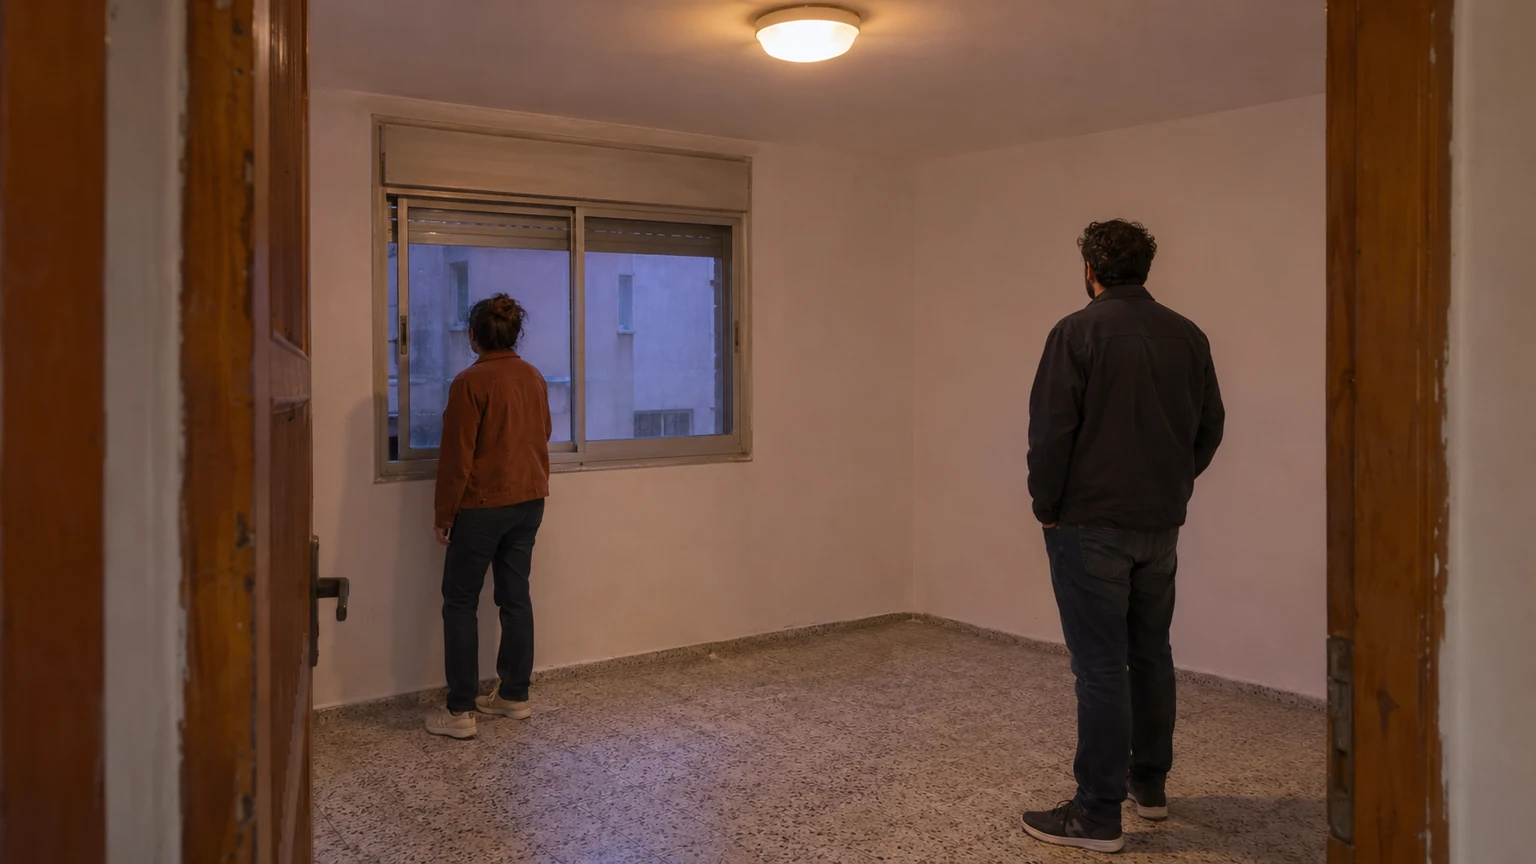
Why did the average fall more than the index?
The average transaction price fell from NIS 2,423,800 in the second quarter to NIS 2,286,700 in the third. That is NIS 137,100 less per recorded deal, calculated from the CBS figures. It does not establish that an owner of the same apartment lost that amount.
The quarterly average covers one- to six-room homes sold on the free market, excluding government-subsidized transactions. It does not adjust for differences in the homes sold. A quarter with a different mix of locations, sizes or property types can therefore produce a different average even without the same change in the value of comparable homes.
The home-price index adjusts for quality differences. It also uses a different time window: the latest comparison is August to September against July to August, two overlapping periods. The quarterly average compares July to September with April to June. The gap between the two percentage changes cannot be attributed entirely to the mix of homes sold.
Where did prices rise and fall?
The national decline concealed a split between districts. Tel Aviv and the South fell, while Haifa and the North rose in the latest index comparison. Jerusalem was unchanged.
| District | Versus July to August 2026 |
|---|---|
| Tel Aviv | Down 0.8% |
| South | Down 0.6% |
| Center | Down 0.2% |
| Jerusalem | Unchanged |
| North | Up 0.4% |
| Haifa | Up 0.8% |
Source: CBS release 361/2026, district indices. These are districts, not individual cities or neighborhoods. The Tel Aviv district figure cannot establish the price change on a particular street in Tel Aviv-Yafo.
The report’s city averages need the same care as the national average. For example, Jerusalem’s average third-quarter transaction price was NIS 3,033,200, down 5.2% from a year earlier. That is an unadjusted city average over a quarter, not a finding that comparable Jerusalem homes fell 5.2%.
Did new homes become cheaper outside subsidized schemes?
The new-home index fell 0.7% in the latest overlapping-period comparison. CBS also calculated a 0.7% decline after excluding government-subsidized transactions. The reported fall therefore remains when those purchases are removed.
This is a price measure. Our earlier report on third-quarter new-home sales examined transaction counts, a separate question. Lower sales and lower price indices can inform a negotiation, but neither supplies a standard discount that every developer must accept.
What should buyers and sellers take from the release?
For buyers, the useful message is that national prices continued to edge lower, with meaningful regional differences. Compare recent completed sales of similar homes in the same area before translating the national figures into an offer. Floor, condition, size, parking and a protected room can make two apparently similar apartments poor comparisons.
For sellers, the average deal price is a weak substitute for evidence about competing homes. A smaller or cheaper group of properties changing hands does not automatically reset the value of a particular apartment. Equally, a high city average does not establish that a higher asking price will attract a buyer.
Our buying-process guide sets out the financing and property checks that sit alongside price comparisons. The next CBS dwelling-price release is scheduled for December 15 at 18:30 Israel time, covering September to October 2026.
Sources
- Central Bureau of Statistics, Changes in the Market Prices of Dwellings, English, November 15, 2026, pages 1 to 6.
- Central Bureau of Statistics, original Hebrew release, November 15, 2026. Figures and scope checked against the original release.
Common questions
Did Israeli home prices fall 5.7%?
The unadjusted average transaction price fell 5.7% between the second and third quarters. The quality-adjusted home-price index fell 0.2% between the overlapping July to August and August to September periods. They measure different things over different periods.
Does the November release describe November purchases?
No. The latest price index covers August and September transactions. The quarterly average covers July to September. Recent figures can be revised as more transactions are reported.
Is this page useful?