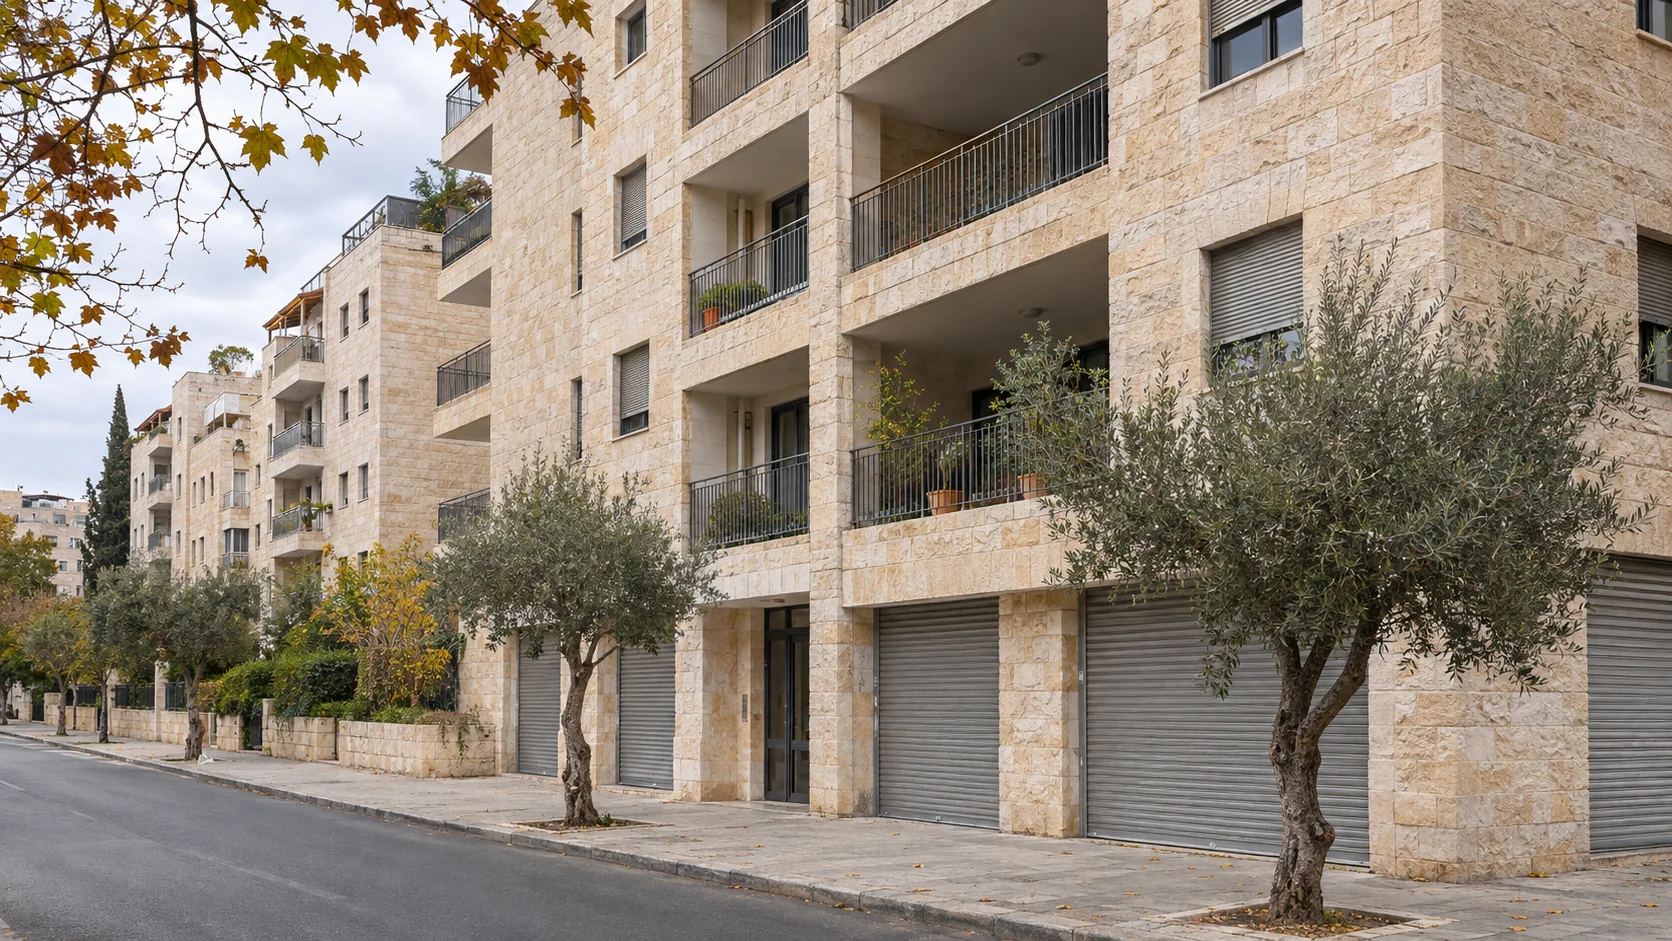
New home sales in Tel Aviv district fell 43% in July to September 2026 compared with the previous quarter, according to figures released by Israel’s Central Bureau of Statistics on 12 November.
The district recorded 1,397 sales, while Israel’s overall housing market also slowed. For buyers, the report offers a reason to compare competing projects carefully, but it does not establish how much any particular seller will discount.
Tel Aviv projects and homes






For Rent
40th-Floor Apartment for Rent in Midtown Towers, Tel Aviv
Tel Aviv
112 m² · Floor 40
View PropertyShort-term rental
central jaffa family summer house
ger tsedek 6, Florentin, Tel Aviv
160 m² · Ground Floor
View Property
For Sale
₪6,650,000
Gindi VOGUE: 4-Room Apartment Rights Assignment in Sde Dov, Tel Aviv
Tel Aviv
4 rooms · 115.8 m² · Floor 2
View Property| Homes sold | Approximate number | Change, unadjusted | Change, seasonally adjusted |
|---|---|---|---|
| All homes | 21,750 | Down 5.7% | Down 6.8% |
| New homes | 9,190 | Down 7.2% | Down 12.2% |
| Resale homes | 12,560 | Down 4.5% | Down 2.7% |
Source: Central Bureau of Statistics, Table 1 and release 355/2026. These are transaction counts, not changes in home prices.
Did sales fall everywhere?
No. Kiryat Gat led new home sales with 1,030 transactions, but 78.3% were government subsidized. Nationally, subsidized purchases accounted for 35.7% of new home sales. Nadlan Center also highlighted this contrast in its 12 November coverage.
That distinction matters when choosing where to buy. A city leading the sales table is not necessarily experiencing a broad surge in demand at unrestricted market prices. Subsidized transactions serve a different group of buyers and can make a city’s headline total a poor comparison for an ordinary apartment purchase.
Geography needs equal care. The headline concerns Tel Aviv district, a wider area than Tel Aviv-Yafo city. It cannot tell a seller what is happening on one street, or whether a particular apartment competes with the projects in which sales have slowed.
Does the September rebound change the picture?
The quarter weakened, but September’s seasonally adjusted total rose about 6% from August, according to CBS Table 1. The unadjusted monthly count fell. Neither measure should be presented as the other.
Seasonal adjustment helps compare months with different recurring calendar patterns. It does not turn one month into proof of a recovery. CBS marks the figures as provisional and warns that the latest three months of adjusted and trend estimates can change substantially.
For someone buying from abroad, this is a reason to put the dates beside every statistic. A report published in November can describe contracts signed months earlier. It should inform a current search, alongside fresh comparable sales and written offers.
Are the unsold homes ready to move into?
CBS Table 2 puts new homes remaining for sale at about 85,080 at the end of September. That is an inventory estimate, not a count of completed empty apartments.
The CBS methodology starts with permits for homes intended for sale and accounts for reported sales. Construction may be at different stages. The bureau says it cannot determine the completed share of this unsold stock from the aggregate series.
For renters, the distinction is immediate: this inventory is not a list of homes available to rent. For buyers with a fixed moving date, a permitted unit and a completed apartment solve different problems. Ask for the actual construction stage, contractual delivery date and evidence supporting it.
How should buyers and sellers use these figures?
Our reading is that slower sales make careful comparison more valuable. Buyers can ask competing developers for written offers covering the same apartment size, floor, parking, payment dates and delivery assumptions. A smaller payment today may leave a larger obligation later. Our report on Gindi’s advertised price and deferred loan explains one concrete example.
Sellers should compare their property with recent nearby transactions and the alternatives a buyer can purchase now. A district sales decline alone is not an appraisal. Semerenko Group’s Q3 recorded-transactions report provides a separate, explicitly limited sample of Tax Authority records across selected cities; it is not the nationwide CBS series above.
Sources
Central Bureau of Statistics: housing transactions for July to September 2026, published 12 November 2026; CBS Table 1: monthly original, adjusted and trend series, published the same day; CBS: inventory methodology dated 14 June 2026; Nadlan Center: Hebrew reporting published 12 November 2026.
Common questions
Did Tel Aviv home prices fall 43%?
No. The figure measures the change in the number of new homes sold across Tel Aviv district between two quarters. It is not a price change.
Does a large unsold inventory guarantee a discount?
No. The report does not identify a seller’s lowest acceptable price. Compare actual offers, total costs and delivery terms for the property you want.
Is this page useful?